Redesign
AB Testing
Convertion Rate Optimizing
Growth Design
Fugle is an innovative and user-friendly investment platform that offers a variety of indicators, charts, and customizable layouts, providing investors with the most personalized and seamless trading experience.
View Live Project

Overview
About Fugle
Fugle is an innovative and user-friendly investment platform that offers a variety of indicators, charts, and customizable layouts, providing investors with the most personalized and seamless trading experience.
Project Background
This portfolio showcases several major redesigns and growth-focused designs I completed at Fugle:
Membership Growth
To increase the number of members and drive the platform’s most crucial metric— Trading Volume.
We optimized the registration process and refined key conversion points to improve conversion rates.
See Details

Interface Redesign
We revamped the interface for the most frequently used features, enhancing the user experience. Additionally, we conducted Qualitative Interviews to validate the design.
See Details
Project Role
Take a look at the project details and the team that makes me proud :)
My Role
Product Designer
Data Tracking
Members
1 Product Manager
1 Product Designer
1 Data / Researcher
3 Developers
Timeline
1.5 Years
2023.02 - 2024.09
Full Time
Tools
Figma
Figjam
GA4
Conversion Metrics
Total Number of Members
Registration Conversion Rate

Due to NDA restrictions in this financial project, we are unable to disclose the detail target numbers here.
User Growth Framework
After researching user onboarding experiences across competitors and reviewing industry best practices, we established three core frameworks to guide our membership growth initiatives.

Validate Value by
Data
We conducted research to identify the most valuable features for our users and validated the impact on registration conversion through A/B testing.
See Details

Minimize Registration
Burden
To encourage sign-ups, we offered social login options and optimized the registration flow to the fewest possible steps allowed under financial compliance.
See Details

Restrict Access for
Non-members
Too many features were available to unregistered users. We aimed to shorten the time they can use without signing up, improve the registration conversion rate.
See Details
Data-Driven Design
Researching
First, we reviewed user perceptions of Fugle based on past user interviews, App Store ratings, and NPS feedback. From this research, we identified two key features that our target audience appreciated the most about Fugle.
Customizable Dashboard for Investment
Clean and Friendly Watchlist experience
What Data Shows
According to GA data, a significant proportion of users leave the site after accessing Fugle's basic features. Additionally, a considerable number of users continue using the basic features without completing the registration conversion.
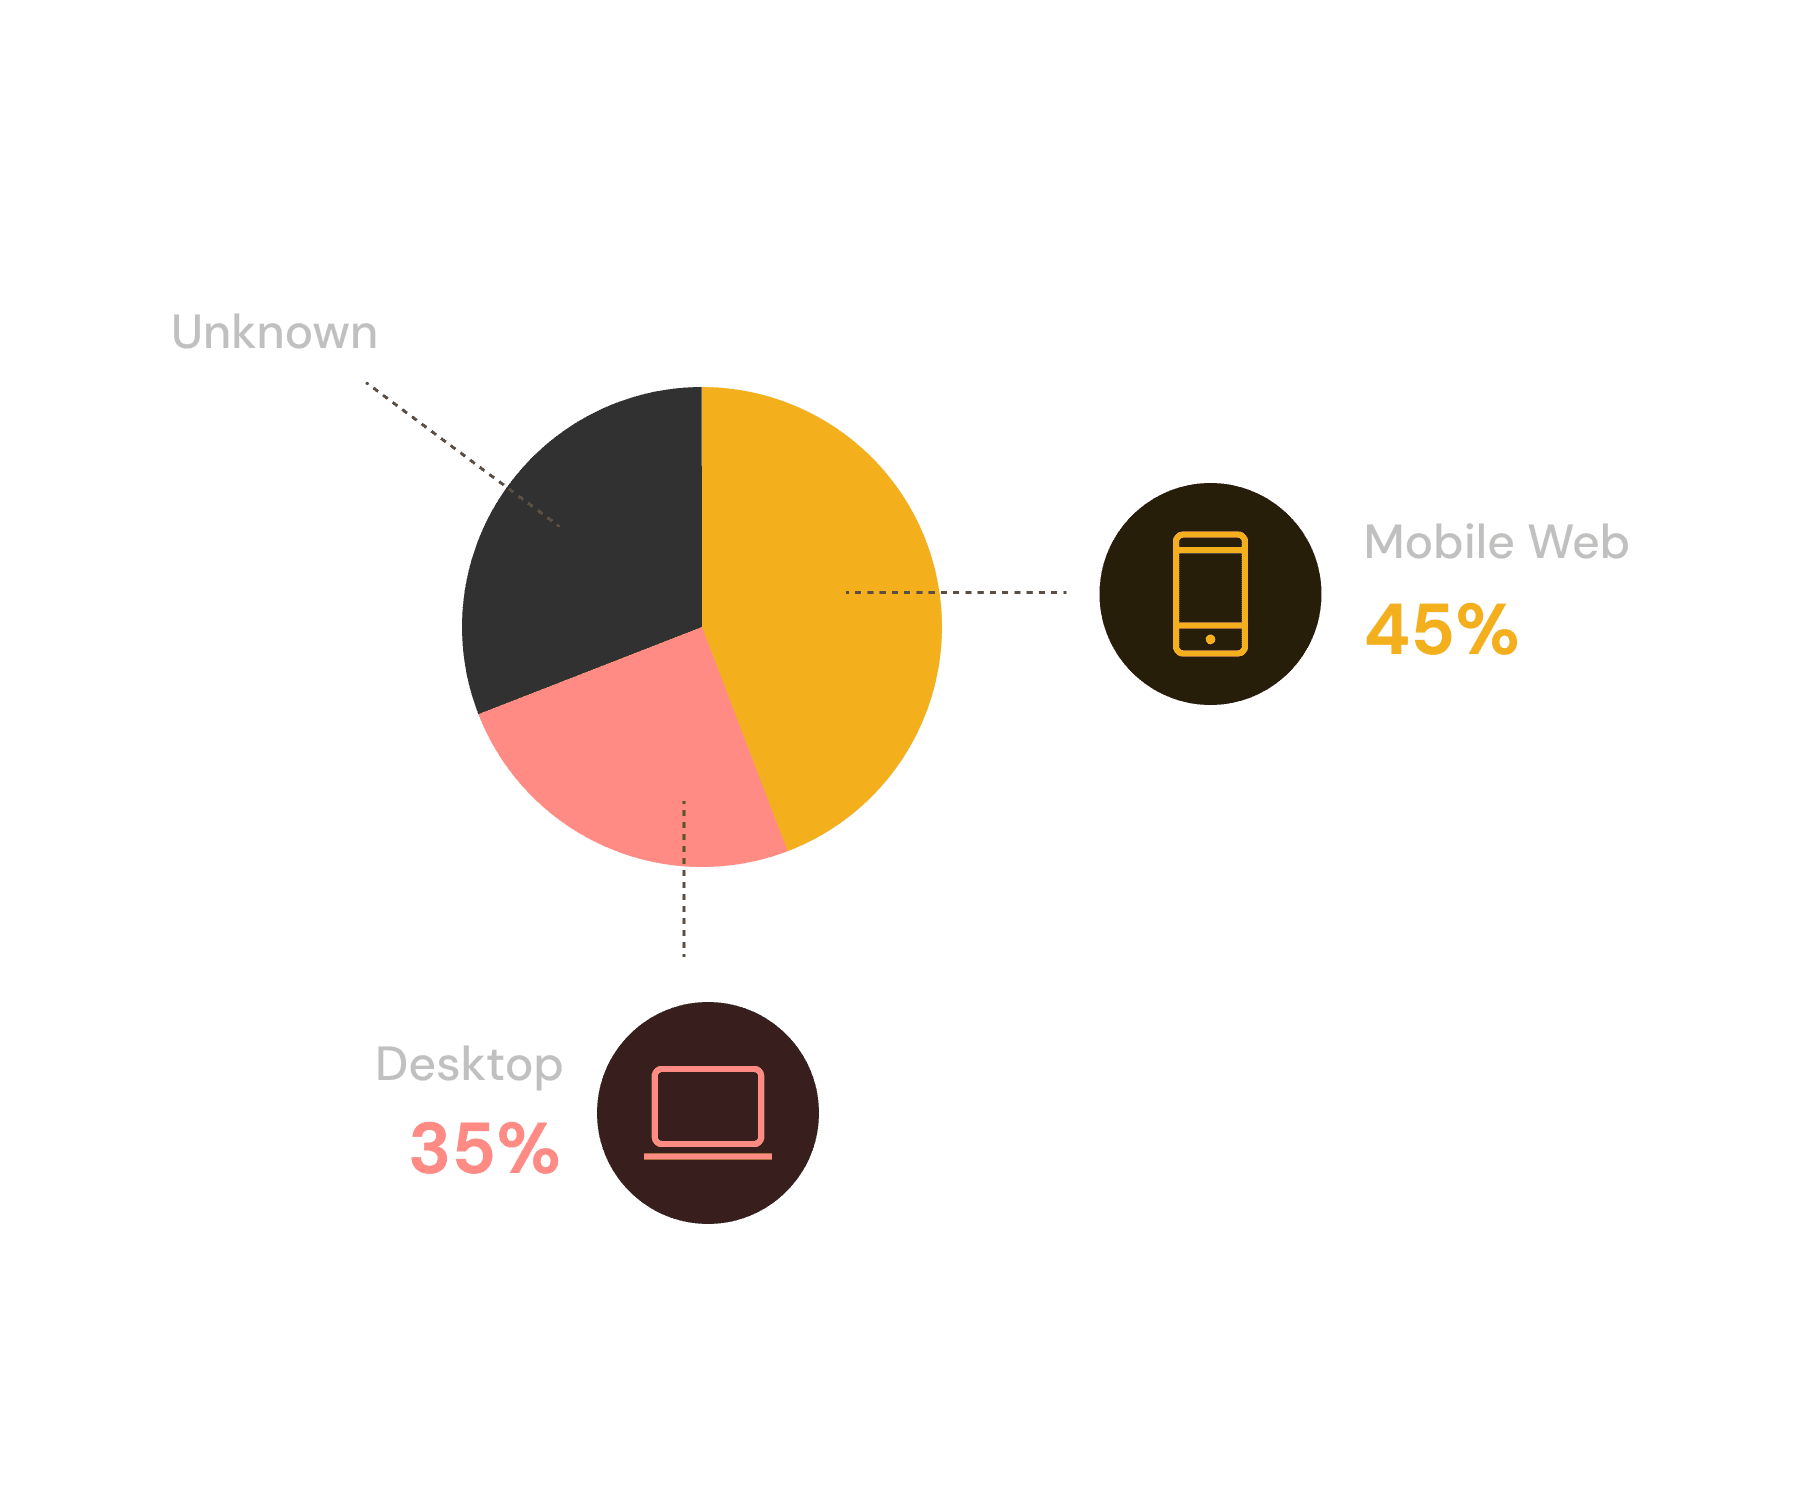
Looking at the device data, a significant proportion of users access the Fugle website via mobile browsers. Therefore, we have included mobile optimization as part of this improvement effort.
A/B Testing Experiments
To begin, we focused on the widely favored Watchlist feature by offering two test variations, aiming to determine which version generates higher sign-up conversions through user clicks.
Hypothesis
Design B will lead to a higher sign-up click-through rate compared to Design A.
Sample Size
10,000
users per group
Timeline
1
month for experiments
These are two different design versions:
Design A
Displays all features available after registration using text along with some icons.The features include Watchlist, Trading, custom charts, note-taking, etc.
We believe that this version has too much descriptive text, and users may not be able to fully experience the functionality's enjoyment through just the text.


Design B
Provides users with a basic functional watchlist where they can view and track their favorite stocks or investments, clearly indicating that users can unlock additional features for customization upon registration.
We believe this feature allows users to experience the value of the tracking function beforehand, thereby promoting higher registration conversion rates.
Experiments Result
According to GA tracking results, Version B had a 1.85% higher click-through rate compared to Version A, but the improvement was not significant. Additionally, the registration completion rate for users in Group B is relatively higher.
From this experiment, we learned that allowing users to experience the watchlist feature first as a way to drive registration is a reasonable design approach, but its impact is limited. This suggests that we may need to further optimize the registration incentives or explore other methods to improve conversion rates.
Final Version
Design B
Result
+1.85% Higher CTR
+0.72% Higher Registration Completion Rate
What we've learned?
The experiment has many variables that could affect the results, and sometimes the strategies we believe will lead to significant growth may not yield the expected results in practice. However, I believe that there are more and better design solutions for improving registration conversion, and I look forward to the opportunity to apply them to more products in the future.
It has been a truly valuable data-driven design experience! 😊
Minimize Registration Burden
We reduced the total number of registration steps, added social media login options, and optimized the visuals and copy to increase traffic to the registration page.


Register Steps
5 to 3 steps
Registration Entry Traffic
+3.6% /monthly
Learning
In addition to improving, we also considered all processes, including technical limitations.
Restricting Access for Non-members
We eventually adopted this more aggressive approach. Of course, we were also concerned that it might interrupt users who were actively using the features, so we adjusted the available time setting multiple times after careful consideration.


The Modal Motivated User Sign-up
Watchlist Animation
Redesign
Qualitative Interviews and Requests
We revamped the interface for the most frequently used features, enhancing the user experience. Additionally, we conducted Qualitative Interviews to validate the design and ensure the updates truly meet user needs. The main features are:
Stock Trading Page
Problems
The information layout is too cramped, making it prone to breaking on small devices.
The overall information hierarchy is unclear, leading to poor readability.
There is a lack of consistency and similarity principles, with some user feedback indicating confusion about the placement of certain elements.
Stock Details Page
Problems
After adding US stocks, the original layout becomes too crowded, making it prone to breaking.
The font size of the price change and percentage change is too small, making it hard to read.


Other Showcase
What I've done in other Projects
These are the core skills I’ve built and key projects I worked on during my time at Fugle.
Creating Reusable Components
By understanding the purpose of each component, I create flexible variants and define key properties, enabling the design team to work more efficiently and consistently.
Prototyping and Testing
I created multiple high-fidelity, interactive prototypes for usability testing, allowing users to experience realistic interfaces before features went live.
Animation & illustration
I enjoy crafting smooth onboarding animations using LottieFiles, and I also bring basic graphic design skills to support visual consistency across different touchpoints.
Navigation Bar & Stock Usage
I designed flexible toggles for switching between pricing types, stock symbols, and other key data views. These components were not only useful for mockups but also helped the engineering team better understand data structures and logic.
I enjoy turning messy parts into clean, reusable systems!
Prototyping for Usability Testing
I created multiple high-fidelity, interactive prototypes for usability testing, allowing users to experience realistic interfaces before features went live.

